R è un buonissimo programma per la grafica. Date le sue ampie possibilità di customizzazione è effettivamente possibile fare grafici praticamente di qualunque tipo.
Di seguito riporto il codice per fare grafici semplici, pronti per la stampa.
FIGURA 1
data(mtcars)
attach(mtcars)
plot(mpg, hp, xlab ='Asse delle X', ylab = 'Asse delle Y',
     xaxt="n", yaxt="n", mgp=c(2.5, 1, 0), cex.lab = 1, type = 'n')
axis(1, at=seq(0,35,5), lwd = 0, lwd.ticks = 1, tcl = 0.2, cex.axis=1,
     mgp=c(1.5, 0.5, 0))
axis(2, at=seq(50,350,50), lwd = 0, lwd.ticks = 1, tcl = 0.2, cex.axis=1, las = 2,
     mgp=c(1.5, 0.5, 0))
points(mpg, hp, cex=0.8, pch=as.numeric(as.factor(cyl)))
abline(v=15, h=100, col='grey', lty = 2)
legend('topright', legend = c('4 cyl', '6 cyl', '8 cyl'),
       pch = 1:3, bty = 'n')
dettach(mtcars)
Created by Pretty R at inside-R.org
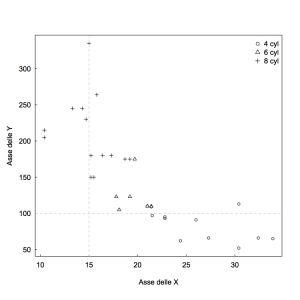
FIGURA 2
require(pls)
data(gasoline)
plot(seq(900, 1700, 2), gasoline$NIR[1,], type='l', xaxt='n', yaxt='n',
     xlab='Wavenumber', ylab='Absorbance', lwd = 0.5, cex.lab=0.8,
     main = 'NIR spectra 1', cex.main=0.9,
     col='black', mgp=c(2.5, 1, 0))
axis(1, at=seq(900, 1700, 50), labels = seq(900, 1700, 50), lwd = 0, lwd.ticks = 1, tcl = 0.2, cex.axis=0.8)
axis(2, at=seq(0, 1.5, 0.20), lwd = 0, lwd.ticks = 1, tcl = 0.2, cex.axis=0.8, las= 1)
grid(col = "lightgray", lty = "dotted", lwd =1)
